P.O Box 01, Uganda | Tel: +256-xxx-xxxxxx | E-mail: [email protected]
Overview
Rubirizi District was curved from Bushenyi district in July 2010. The District has 2 counties of Bunyaruguru and Katerera. The district is composed of 9 Sub counties and 2 Town councils. The Sub counties include; Rutoto, Ryeru, Magambo, Kichwamba, Katunguru, Kirugu, Katerera, Katanda and Kyabakara. Town Councils include; Rubirizi and Katerera. The District is constituted of 53 Parishes and 294 Villages.
District Profile
Key Geographical information
Rubirizi District mainly comprises of Banyaruguru, Banyankole, Bakiga, Baganda, Batoro and Bakonzo. The main physical features of the district include Natural forests of Karinzu, Imaramagambo and Kasyoha – Kitomi covering an estimated area of 784 km2.
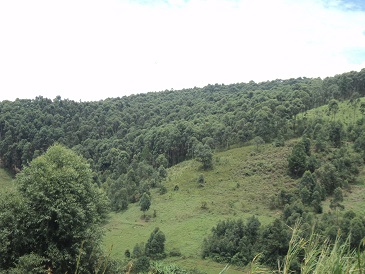
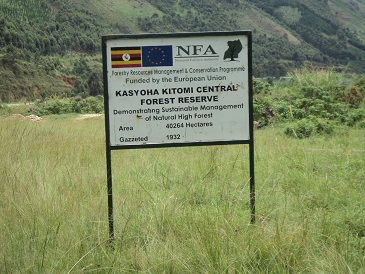
Part of Kasyoha kitomi forest
The water bodies are lakes- Edward, George, Kazinga channel and 32 crater lakes.


Part of Lake George in Katunguru S/c
The Queen Elizabeth National Park partly is located in Rubirizi District and falls within the Western arm of the East African rift Valley.
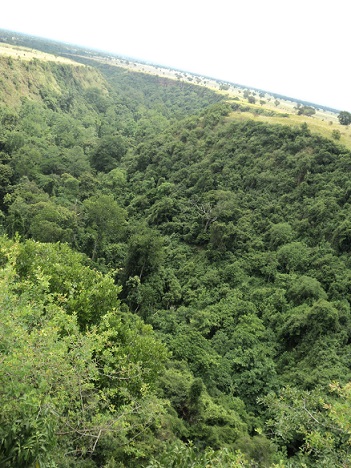
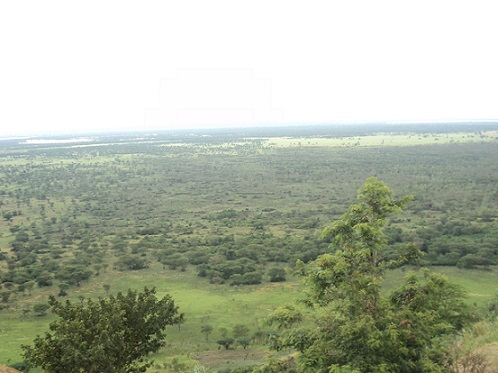
Kyambura Gorge in Kirugu Sub County & Arial view of Queen Elizabeth NP
The major Economic activities include; semi intensive agriculture, fishing, trade and commerce, transport, stone quarrying, sand mining, mineral mining, construction industry, tourism and lumbering.
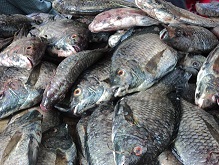
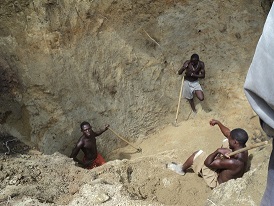

Fishing, sand mining in Katunguru S/C & Transport and Trade in the District
Location
The district lies between 0o N and 0o 46’ S of the equator and 29o 41’ East and 30o30’ East of Greenwich. It is surrounded by the districts of Kasese in the North, Kamwenge and Ibanda in the North East, Bushenyi in the south, Rukungiri in the South West and Buhweju in the East. It also borders the Democratic Republic of Congo in the West across Lake Edward.
Topography
The district is hilly with sharp valleys and craters.
Climate
The district receives 1500-2000mm of rainfall annually and the mean annual temperature ranges from 12.5o C to 30o C. This climate is conducive and suitable for agricultural activities carried out in the district.
Soils and Vegetation
The district is endowed with loamy fertile soils with varying proportions of sand and clay. It has tropical rain forest vegetation of Kalinzu, Imaramagambo, Kasyoha-Kitomi in the central and savannah woodlands, semi arid vegetation in the north and wetland vegetation.
Land Utilization
|
Land use |
Area (km2) |
Percentage |
|
Tropical rain forests |
784 |
50 |
|
National park |
393 |
23 |
|
Open water bodies |
370 |
20 |
|
Wetlands |
4 |
7 |
|
TOTAL |
|
100 |
Average land holding 0.8ha
Health Infrastructure
|
Level |
katerera |
Bunyaruguru |
Total |
|
Hospitals |
0 |
0 |
0 |
|
Sub District Health Centres [HSDs] |
0 |
1 |
1 |
|
Health Centre IIIs |
1 |
2 |
3 |
|
Health Centre Iis |
3 |
9 |
11 |
|
Totals |
4 |
11 |
15 |
Administrative structure
This shows information of the LG administrative units and organizational structure for Rubirizi district as shown below;
LG administrative units in Rubirizi district
|
County |
Sub county |
Town council |
Parish |
Ward |
Villages |
|
Bunyaruguru |
05 |
01 |
30 |
04 |
148 |
|
Katerera |
04 |
01 |
32 |
04 |
146 |
|
Total |
09 |
02 |
53 |
08 |
294 |
Population by sex by Sub County, 2014 and Household size
|
SUB COUNTY |
No. HHds |
Av. HHd size |
Males |
Females |
Total Popn |
|
KATUNGURU |
1,369 |
2.8 |
2,158 |
1,647 |
3,805 |
|
KICHWAMBA |
3,633 |
4.6 |
8,027 |
8,614 |
16,641 |
|
MAGAMBO |
2,475 |
4.7 |
5,561 |
5,996 |
11,557 |
|
RUBIRIZI TC |
1,966 |
4.2 |
3,845 |
4,359 |
8,204 |
|
RUTOTO |
2,976 |
4.5 |
6,185 |
7,066 |
13,251 |
|
RYERU |
2,761 |
4.8 |
6,138 |
7,103 |
13,241 |
|
KATANDA |
3,891 |
4.8 |
8,994 |
9,834 |
18,828 |
|
KATERERA |
2,344 |
4.5 |
4,965 |
5,524 |
10,489 |
|
KATERERA TC |
2,147 |
4.2 |
4,330 |
4,740 |
9,070 |
|
KIRUGU |
2,476 |
4.6 |
5,416 |
5,886 |
11,302 |
|
KYABAKARA |
2,760 |
4.6 |
6,146 |
6,615 |
12,761 |
|
28,798 |
61,765 |
67,384 |
129,149 |
Source: UBOS, final results NPHC 2014
From the table above, Katanda Sub county has the biggest population (15%) followed by Kichwamba sub county (13%). The former lies at the edge of the central forest reserve with high illiteracy levels. This means that special interventions in education are required. There is no government health facility to provide information regarding family planning. The later also adjacent queen Elizabeth protected area (QEPA Katunguru Sub county has the lowest population because the population is composed of the fish folks. It is also in the middle of QEPA and has limited land for expansion. The above demographic characteristics imply that more resources should be allocated to Katanda and Kichwamba sub counties for equitable development.
Natural Endowments
The district is host to Queen Elizabeth protected area and also shares the Kasyoha - Kitomi Central Forest Reserve. This makes it a tourist hub hosting over 20 medium star visitor facilities. Being located the edge of the Rift valley; It also has substantial deposits of pozollana (limestone). Lakes Edward, George the Kazinga and 32 minor lakes Channel are potential fishing grounds.
Social Economic infrastructure
The socio-economic characteristic entails the well being of the community. It includes the housing conditions, household assets, incomes and outstanding loans, household expenditure, welfare indicator and cultural participation of household members.
Housing conditions by type of house
Housing is one of the basic human needs that have a profound impact on the health, welfare, social attitude and economic productivity of the individual. It is also one of the best indications of the person’s standard of living and his/her place in society.
In addition, building materials determine the stability and durability of house over years. 95% of the housing units in the district are roofed with iron sheets, 5% are grass thatched. The number of houses built with burnt bricks and roofed with iron sheets is on an upward trend and thus improving the housing conditions in the district.
Main sources of household livelihood
Table: 1.4 Main source of household livelihood
|
Source Livelihood |
Percentage |
|
Subsistence farming |
78.8 |
|
Employment income |
9.2 |
|
Business enterprise |
6.3 |
|
Family support |
4.2 |
|
Other |
1.6 |
|
Total |
100 |
Source: 2014 Population census
The majority of the households (79 percent) depend on subsistence farming for livelihood. About 15 percent of the households depend on employment and enterprise income. Subsistence farming is also dominant in the rural areas commanding 82 percent of household welfare.